If you buying or selling a house. The relator will tell the value of the property is all about location, location, location. For insurance companies location is just as important.
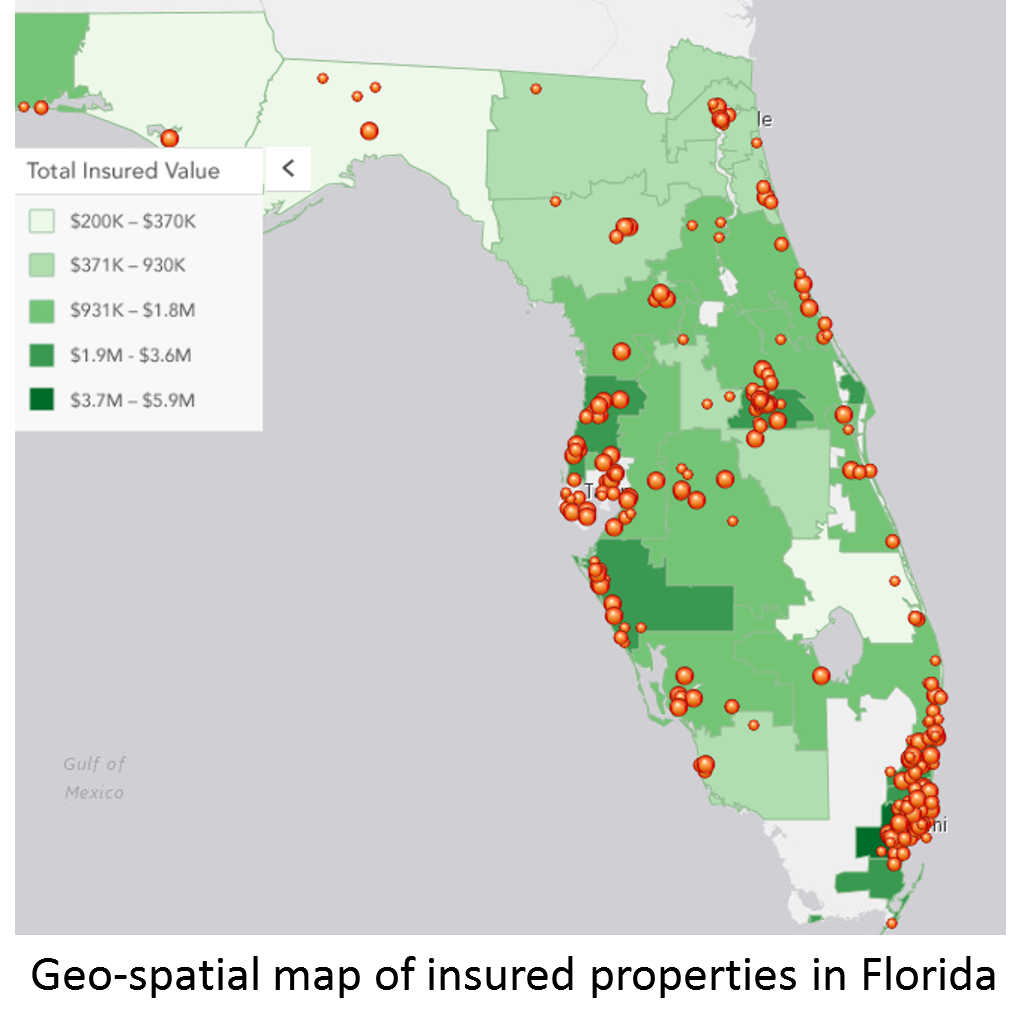
For an underwriter assessing the risk on a property is essential that they consider the location of the property. How close is it to the coastline? Is it a flood plain? Where is the nearest fire station? It is even important to know the types of businesses in surrounding properties. A clothing manufacturing next to a fireworks store is a greater risk than if the neighboring property sold sports equipment. Traditionally underwriters have relied on quotation data from the insured or agent, plus information from local adjusters. Now underwriters are supplementing that information with geo-spatial data.
Of course, it is impossible to predict exactly where a natural disaster will hit, but quickly predicting the exposure is essential when catastrophe strikes. When torrential rain inundated the city of Calgary in June 2013, Aviva Canada used SAS Visual Analytics to quickly determine which customers were most affected. By combining policy data with geocoding software, SAS provided Aviva Canada executives with a dashboard to easily monitor the amount of claims coming in. This resulted in speedier claim fulfillment, lower fraud rates and better customer retention. Read more about the AVIVA Canada case study.
There are many other business applications for location analytics within insurance. One example is marketing. Insurance companies have always created customer segmentation. However now insurance companies are can create micro-segmentation down to a hyperlocal level. Overlaying internal customer data with behavioral and demographic information, marketing analysts can identify sales gaps and untapped opportunities.
Another example is using geo-spatial data to quickly find emerging trends in fraudulent and suspicious activities. This video shows how quickly and effectively an insurance company could reveal anomalies in the data. In this instance, by analyzing the data the insurance company was able to discover that the spike in claims were related to unscrupulous, out-of-state, contractors targeting elderly policyholders for unnecessary property repairs.
SAS Visual Analytics and location analysis empowers underwriters, adjusters, marketing specialists to better assess risk, be more efficient and increase revenue. Are you using it?
I’m Stuart Rose, Global Insurance Marketing Director at SAS. For further discussions, connect with me on LinkedIn and Twitter.